
Suppose you are a doctor who offers services like primary care, gynecology, allergy testing, and more and want to be found at the top of Google for these services in and around your location. In that case, local SEO is what you are looking for. Local SEO from TM Blast (by Greg Kristan) focuses on the following optimizations for your business.
- Google My Business Listing Optimization
- Bing Places for Business Optimization
- Getting listed on Apple My Business
- Getting listed on relevant business directories in your town or city to increase referral traffic
- Improving your organic rankings in and around your location for your keywords
- And more!
95% SoLV Improvement for a Local Client’s Target Keyword in One Week
SoLV stands for Share of Local Voice, a metric from Local Falcon. The stat is a percentage of how many times in the grid + distance you run the keyword search for that a company will be in the top 3. A week ago, my client out in NYC had about a 4% SoLV for their target term. Today, they are at 99%, which means they will get many more phone calls to their business for this service.
Local SEO Success Story
A NYC Doctor SEO Case Study
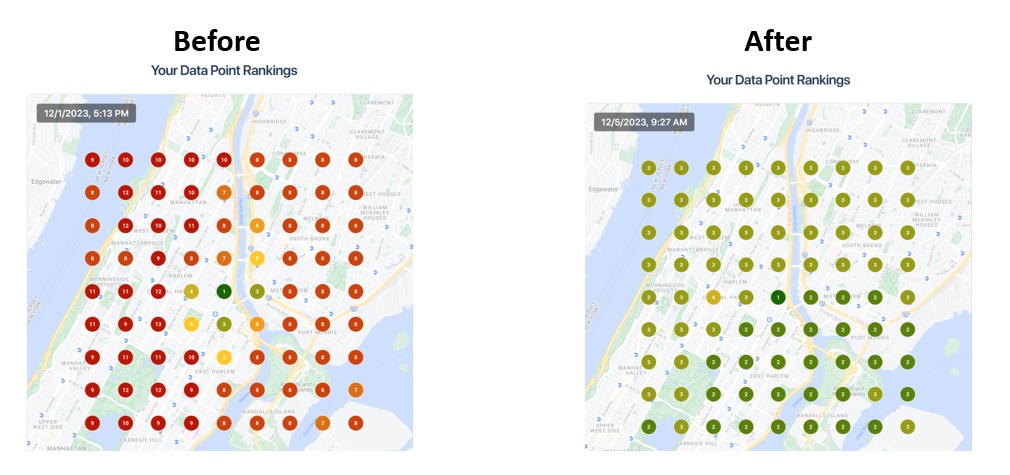
I (Greg Kristan) have been working on the SEO strategy for a doctor out in NYC since 2020. Their NY Local SEO has been so successful over the years that they opened up a second location in the city. This image above shows how they are ranking for one of their target keywords in a mile and a half radius around their practice.
The Google Map Pack Listing for Doctors

As a doctor, you want your business to appear in the three-map pack listings in and around your location on Google. Getting in the map pack listings makes it easy for potential clients to call you directly. As a note, Google only shows three organic listings in this area, so getting in positions 1-3 is critical.
For example, if you offer primary care services, you want to appear at the top of the map listing so someone can call if they need to schedule a visit and become a future patient of your practice.
In that image above, Google understands that as a searcher, I want to find primary care practices in Brooklyn. Therefore, Google will present a local map pack (sometimes at the top of the results) to visit.
Bing Map Pack Listing
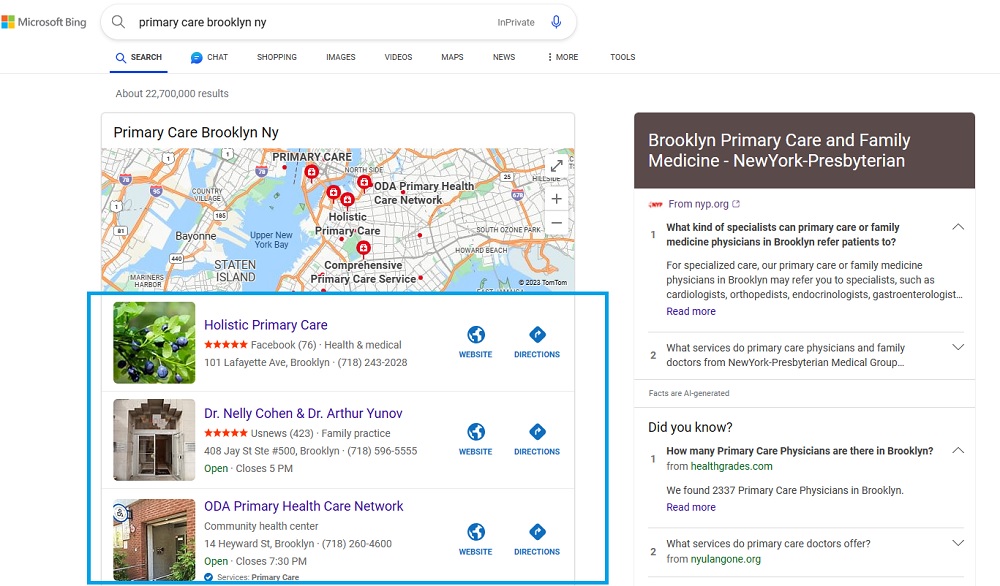
Bing should be part of any local SEO strategy. At the minimum, I will sync whatever changes we make into Google My Business and Bing. If you don’t have a Bing Business page verified, I will help you get that.
How much traffic Bing brings to your business will obviously vary. Mostly, you can expect around 7% of your traffic from Bing to result in additional leads throughout the year.
Apple Business Connect
Apple Business Connect is a new player in the SEO field, and all local doctors should have this listing verified. These map listings is critical for anyone using Apple Maps to look up a doctor’s practice. For example, someone searching for “Primary Care” in Apple Maps will be presented with local options. Those options come from Apple Business Connect.
How much traffic you get tends to be less than Bing, but it is still a channel worth optimizing for.
Traditional Local SEO Keyword Rankings
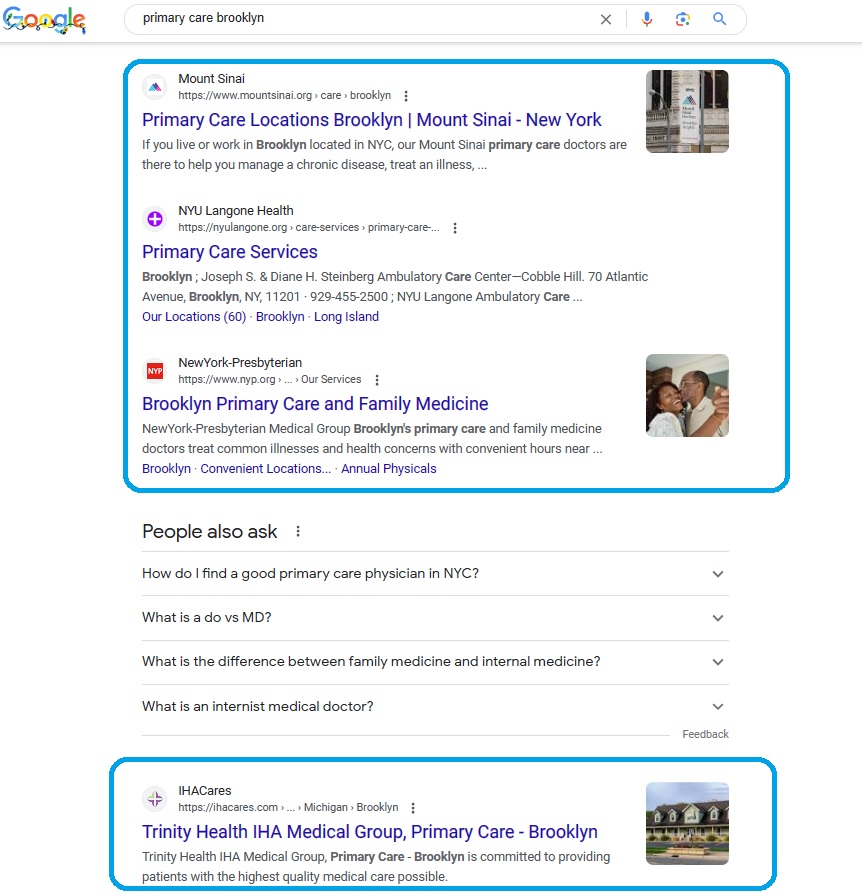
Outside of ranking in the map results, TM Blast also tracks your non-brand keywords in the city or town that you are located in. Ideally, you want to rank both in the map listing and the organic listing, which results in two chances to get someone to interact with your business. A non-brand keyword is “primary care” when a searcher seeks a service, not a specific practice.
What is the Cost?
SEO for Local Doctors starts at $1.3k per month. There is no long-term contract so that either party can cancel at any time for any reason. Most of my clients see a noticeable improvement in traffic and leads by month three, but it all depends on how competitive your industry and location are.
However, if you have two or more locations you want me to work on, the price will be $1.9k per month. For example, if you are a doctor with an office in Brooklyn and Manhattan, I would charge the $1.9k since I’m optimizing two different locations.
What Does the Cost Include Per Month?
- Access to Greg on Slack or Microsoft Teams to ask any questions. My typical response time is less than an hour.
- Greg handles all website optimizations on your behalf.
- That includes making title tags, meta name descriptions, ALT tags, header tags, internal linking, and more optimizations.
- TM Blast handles any one-off technical optimization on the site. For example, if you want your phone number at the top of your site, TM Blast can hire their web developer to handle that request.
- A monthly SEO report that details your numbers, what I did, and much more. This report is not auto-generated, so you will understand what you are looking at
- One 30-minute call each month if you choose
The SEO Tools I Use for Doctor SEO
- LocalFalcon: (That is the heat map in the video above. I use this tool for all of my clients and on TM Blast. It helps with NAP (name, address, phone number).
- Google Business Profile: (This is the primary SEO tool I use to optimize local websites)
- Bing Places for Business: (Bing can make up ~10% of your digital marketing traffic, so it is best not to ignore)
- Apple Business: (Apple can help with anyone searching in Apple Maps for your service)
- SEMRush: (This is how I track your keyword rankings, perform keyword research, track competitors, and run weekly health audits of your website)
- Google Analytics: (I can see the number of visits to your website, goals that occur, and much more)
- Google Search Console: (I can see the keywords that trigger clicks to your website, any technical issues present, and much more)
- Bing Webmaster Tools: (I can see how Bing crawls your website and ensures there are no issues)
- Clearscope: (I use this tool to optimize the content on the website)
What Others Have to Say about My SEO Company
Don’t just take my word for what I can do. See what others have to say about TM Blast! As a note, I, Greg Kristan, do all SEO work. No junior member or intern is working on your account.
Looking to Start?
You’ve come to the right place if you are looking for more potential clients from increased organic traffic. You can fill out the form below to get started!
I will likely perform a Free SEO Audit of your website to give you a baseline of your metrics. The Free SEO Audit also gives me an idea of what I will be working on for your account if you become a client of mine.
Additional Services that I Provide
Greg Kristan, owner of TM Blast, LLC and The Stadium Reviews, LLC, has over 10+ years of SEO experience. He was also the SEO Manager at edX and was a contractor for Microsoft Bing Ads. Today, he works on optimizing local, national, and international company websites to rank higher in search engines through SEO. Finally, Greg has been featured on podcasts about his search experience and regularly updates his YouTube channel sharing digital marketing tips. Do you want to reach out to me about SEO help? If so, email me at greg@tmblast.com or call 877-425-2141